Local property market – 4th Quarter 2021
Listed property performed exceptionally well over the quarter returning 8.4% and 36.9% for the year ending 2021. However, it is important to note the considerable base effect at play within the sector, which still has a negative 3 and 5-year annualised return.
The property sector faces a systemic shift in demand amid rising online sales activity, and as more companies permanently adopt a work-from-home approach. As demand requirements for the
post-pandemic era become clearer, so too should the outlook for the property sector.
The GTC Real Estate Fund handily outperformed the South African listed property index for Quarter 4 of 2021 (10% vs. 8.4%). This was a strong performance for a passive, rules-based portfolio and so far, confirms that the underlying investment strategy – the risk parity approach – is working well.
GTC Real Estate Portfolio
| As at Dec 2021 | 3M | 6M | 1YR | 2YR | Since common inception |
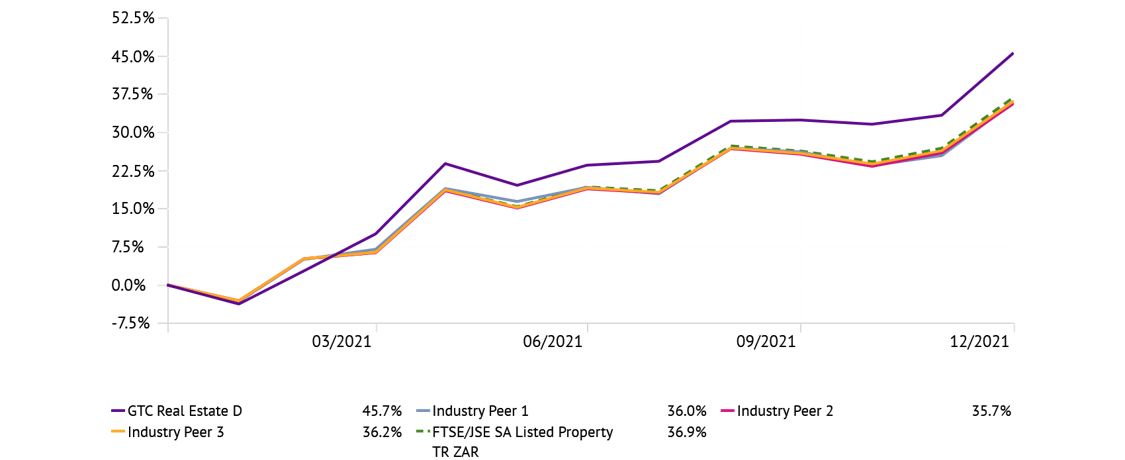
| GTC Real Estate | 9.98 | 17.93 | 45.69 | -1.64 | -2.26 |
| Industry Peer 1 | 7.77 | 14.08 | 35.98 | -5.86 | -5.93 |
| Industry Peer 2 | 8.01 | 14.21 | 35.75 | -6.01 | -6.18 |
| Industry Peer 3 | 8.21 | 14.43 | 36.20 | -5.55 | -5.74 |
| FTSE/JSE SA Listed Property TR ZAR | 8.35 | 14.78 | 36.94 | -5.28 | -5.45 |
All returns are net of fees.
Returns longer than 1 year are annualised.
Relative to well-known industry peers operating in the same sector, as well as the South African listed property index, the GTC Real Estate Fund has performed remarkably well. On a net of fees basis, the GTC Real Estate Fund has earned more than 8.4% against each peer and the index over the 2021 year. Since inception, the GTC solution delivered more than 3.2% ahead of all peers and the index, while taking on considerably less risk in the form of volatility (standard deviation) and capital loss (maximum drawdown).
| Since inception to 31 Dec 21 | Return | Std Dev | Max drawdown |
| GTC Real Estate | -2.26 | 32.65 | -46.77 |
| Industry Peer 1 | -5.93 | 38.11 | -52.49 |
| Industry Peer 2 | -6.18 | 36.66 | -52.13 |
| Industry Peer 3 | -5.74 | 36.66 | -51.89 |
| FTSE/JSE SA Listed Property TR ZAR | -5.45 | 37.00 | -51.96 |
All returns are net of fees.
Returns are annualised.
The graph below illustrates the superior returns delivered by the GTC solution during 2021.
1 Year investment growth – 1 January 2021 to 31 December 2021